Uruguay Export Map:
Trade Structure
and Market Position
Uruguay’s exports follow a clear territorial logic. Beef, pulp, soy, rice, dairy and industrial products come from different clusters — and those clusters shape China exposure, EU-Mercosur opportunities and the country’s market position.
Uruguay exports through a set of territorial production clusters. Rice comes from the east, soy from the west, beef from the north, cellulose from the interior and dairy from the San José corridor. This geography is central to understanding the country’s trade logic.
The export map belongs inside the wider Uruguay market context. It explains why the country can be small in population but highly visible in specific trade categories, from beef and pulp to rice quotas, soy exports and dairy flows.
Market reading: Uruguay’s export position is cluster-based. Each cluster has its own product logic, infrastructure, buyer exposure and quota strategy. The export map therefore works as a practical guide to market position, trade risk and sourcing opportunity.
Uruguay’s export story is often told in national aggregates: total export value, top products and main destination markets. Those numbers are useful, but they hide the operational structure of the country’s trade economy. The relevant question is where each product comes from, which global buyer it reaches and which infrastructure makes the flow possible.
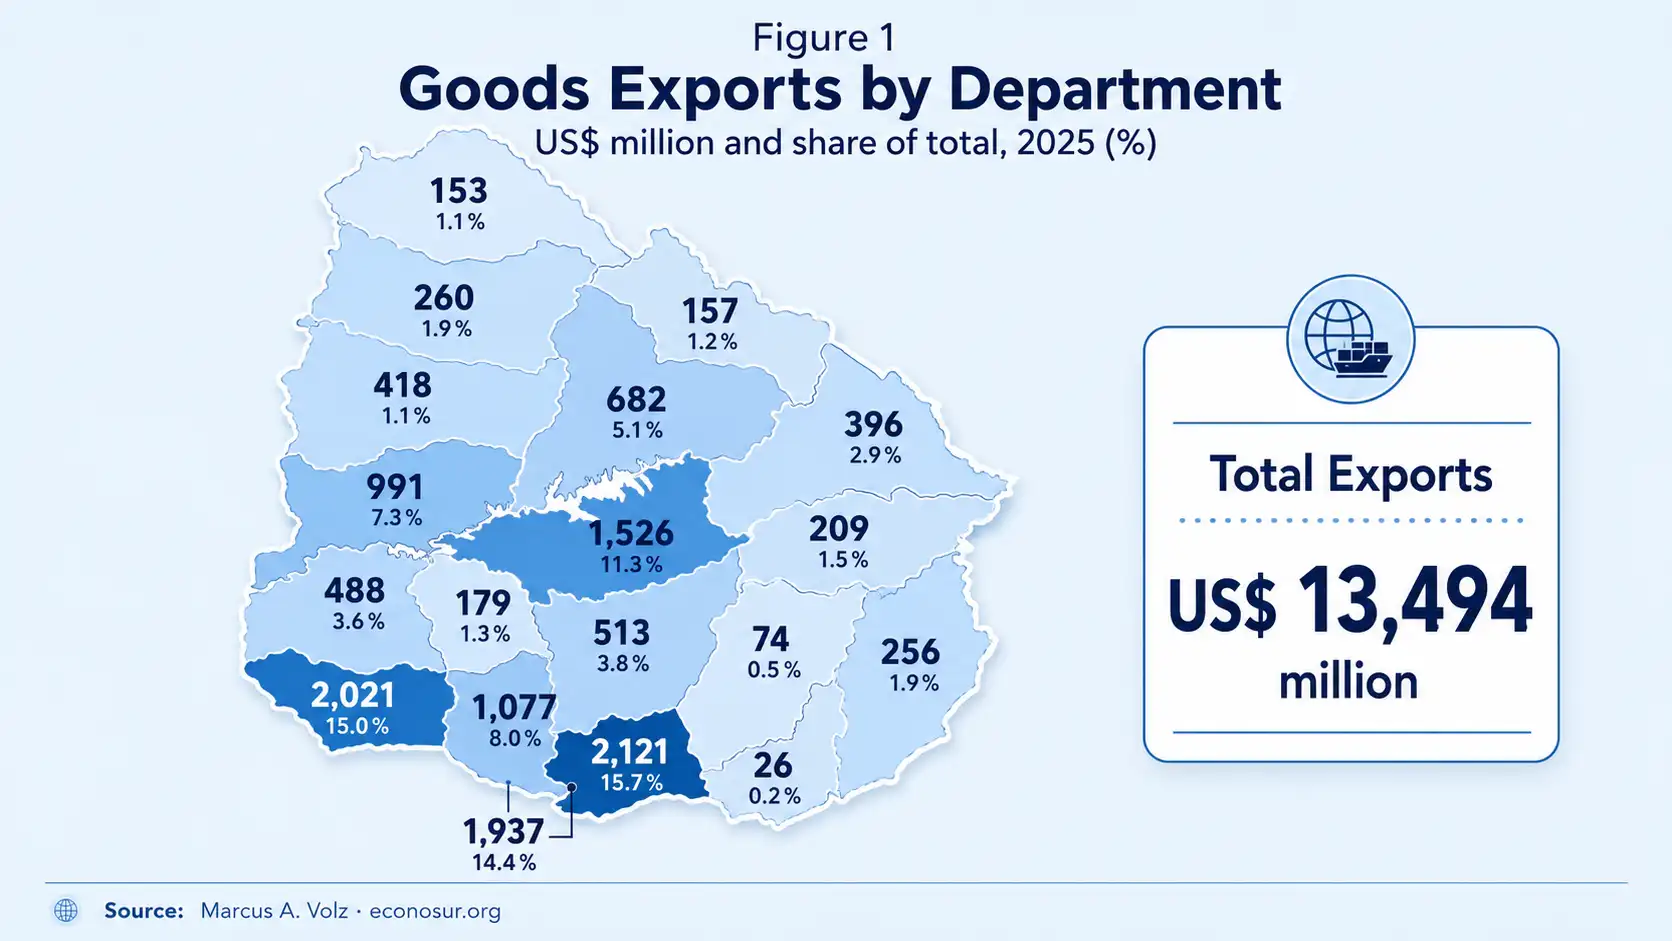
In 2025, Uruguay’s goods exports reached US$13.49 billion, the highest level of the past decade. Behind that national figure lies a patchwork of regional specializations: a beef-dominant north, a cellulose-producing interior anchored in free trade zones, a soy-growing west, a rice-exporting east and a dairy corridor around San José. Three departments — Canelones, Colonia and Montevideo — carried 45% of the national total between them. The remaining 55% was distributed across 16 other departments, each with its own product logic.
Reading Uruguay through that territorial lens changes how you interpret its trade flows, its China dependence, its EU-Mercosur positioning and its capacity to respond to market shocks. It also complements the broader argument developed in The Logic of the Small Market: Uruguay’s scale makes the structure easier to read, but the strategic logic is more complex than population size suggests.
Three Departments, 45% of the Total
The geographic concentration of Uruguay’s exports is striking even by the standards of a small, open economy. Canelones, Colonia and Montevideo together accounted for nearly half of total goods exports in 2025. Each of the three operates on a different model.
Canelones led national exports with a 16% share. Beef accounts for 57% of its departmental total — the highest absolute volume of beef exports in the country. Canelones is also the most industrially diversified department outside the capital, with significant pharmaceutical and plastics output complementing its agricultural base.
Colonia ranked second at 15%, and its export logic is built on free trade zone infrastructure. More than 70% of Colonia’s exports originate in its free zones, driven by cellulose and beverage concentrates. The department’s headline numbers are heavily shaped by the operations of large industrial plants rather than dispersed agricultural production.
Montevideo, at 14%, is the most diversified exporter of the three. Vehicles lead its basket at 20% of the departmental total — a significantly smaller dominance than the leading product in almost every other department. The capital functions as Uruguay’s industrial and logistics hub for manufactured and processed goods, with vehicles, plastics, margarines and oils all playing meaningful roles.
Uruguay is an archipelago of production clusters, each with its own product logic, destination markets and competitive positioning.
Reading the Cluster Map
Beyond the top three, Uruguay’s export geography follows a clear spatial logic that reflects the country’s agricultural and industrial structure.
The interior departments of Durazno and Río Negro are defined by cellulose. Durazno allocates 65% of its departmental exports to pulp production, Río Negro 62%. Both departments host large pulp mill facilities in free trade zones, whose output is attributed to the department of production rather than Montevideo’s port. These two departments together channel a significant share of Uruguay’s cellulose exports toward the EU and China. This cluster connects directly with the separate Econosur analysis of Uruguay’s pulp and cellulose sector.
The west — Soriano in particular — is Uruguay’s soy corridor. Soriano allocates 72% of its exports to soybeans, the highest concentration of any single product in any department. Paysandú and Flores follow the same pattern, each with soy as their primary export product. Together these departments feed into Uruguay’s agricultural trade relationship with China.
The north and northeast are beef country. Tacuarembó and Salto each direct more than 60% of their departmental exports toward beef, while Cerro Largo allocates 51%. The livestock-raising tradition of Uruguay’s interior is concentrated in these departments, which supply the processing plants — primarily in Canelones — that dominate the country’s beef export volumes.
The east is rice. Treinta y Tres sends 71% of its exports as rice — one of the most specialized departmental profiles in the country. Rocha reaches 43% and Artigas 49%. This eastern rice belt is a long-established agricultural system with strong institutional capacity, high compliance with sanitary standards and a well-developed supply chain oriented toward international buyers.
San José completes the picture as Uruguay’s dairy hub. The department leads dairy exports nationally, accounting for 60% of total Uruguayan dairy sales abroad. Its specialization in milk powder, cheese and processed dairy products is reflected in a departmental export basket where dairy accounts for 52% of the total.
Market intelligence point: Uruguay’s clusters have different buyer bases, price exposures, infrastructure needs and geopolitical risk profiles. A cellulose department exposed to EU and Chinese pulp demand is not the same market system as an eastern rice department competing for EU quota access.
China as a Structural Factor
In May 2026, China was Uruguay’s largest export destination, absorbing 27% of total goods exports at US$297 million. Over the January-to-May period, total goods exports reached US$5.27 billion, up 3% year on year. The China relationship is a structural feature of Uruguay’s trade architecture.
The product concentration inside that relationship is the key issue. In May 2026, soy, cellulose and beef together explained 88% of Uruguay’s China-bound exports. Soy led with 42%, followed by cellulose at 23% and beef at 23%. This is a concentrated commodity corridor between Uruguay’s western soy cluster, its interior cellulose departments and China’s bulk commodity demand.
The implications are clear. When soy harvests underperform — as they did dramatically in the 2022–23 drought year, when production collapsed by more than 70% — Uruguay’s China exports fall sharply. When cellulose prices soften, the interior departments absorb the hit. When Chinese demand for beef shifts, Canelones and the northern livestock corridor feel it first.
Uruguay’s 2025 export record was partly driven by the recovery of soy volumes after the drought and a 33% surge in beef exports. That cyclical bounce is real, while the structural exposure remains. The cluster map and the China map overlap heavily.
EU-Mercosur: The Quota Race Begins
The EU-Mercosur trade agreement entered provisional application on 1 May 2026. In the weeks that followed, Uruguay demonstrated how territorial specialization can translate directly into competitive advantage.
Within the first weeks of the agreement, Uruguay captured 63% of the total Mercosur EU rice quota of 6,667 tonnes for 2026. The quota operates on a first-come, first-served basis, and Uruguay moved faster and more decisively than any of the other three Mercosur partners. The reason is compliance capacity. Uruguay is the only Mercosur country whose rice production fully meets EU sanitary requirements. That advantage was built over years in the eastern cluster departments and became commercially useful the moment the agreement opened.
Uruguay’s acting foreign minister acknowledged at the time that the first-come, first-served mechanism would force the Mercosur partners to negotiate an internal distribution framework. The rice episode has already generated diplomatic tension. The beef quota, covering 99,000 tonnes at a 7.5% preferential tariff, represents a much larger commercial prize and will involve much fiercer competition from Brazil and Argentina.
For Uruguay’s northern beef departments, the EU-Mercosur quota is a meaningful opportunity. Canelones, Tacuarembó and the interior livestock zones already send significant volumes to the EU and the US. The agreement’s phased quota expansion gives those clusters a structured path toward higher European market access, provided the sanitary and traceability requirements are maintained.
Uruguay captured 63% of the Mercosur EU rice quota because the eastern cluster had built the compliance infrastructure before the quota opened.
May 2026: A Monthly Signal Read Through the Map
The monthly foreign trade data for May 2026, published by Uruguay XXI, reflects the cluster logic clearly. Total export applications reached US$1.142 billion, down 3% year on year — a mild contraction driven primarily by lower beef and cellulose volumes. Within that overall figure, soy surged 45% as the new harvest began moving, and dairy products rose 29%, with Brazil and Algeria absorbing the bulk of the increase.
Reading those numbers through the cluster map: the west was strong because the 2025–26 soy harvest was normalizing after prior disruption. The north was weaker because livestock slaughter volumes were down 18% in the first five months of 2026 compared with the prior year — a structural cattle cycle effect. The cellulose departments were stable in volume terms but facing lower average prices. The dairy cluster was gaining, driven by strong demand from Brazil and North Africa.
The EU was absorbing less from Uruguay in May 2026 — down 20% year on year — reflecting lower cellulose and beef purchases. At the same time, Uruguay’s rice cluster was winning its first major quota allocation under the new trade architecture.
What the Map Means for Trade Strategy
Uruguay’s territorial specialization has practical implications for anyone operating in, sourcing from or analyzing the country’s trade flows.
For EU importers and investors, the EU-Mercosur agreement creates a new layer of relevance. The agreement is about quota categories, sanitary compliance, traceability and the ability to move quickly when quotas open. Uruguay’s cluster infrastructure — particularly in rice and beef — makes it a credible and already-active counterpart in those categories.
For companies evaluating Uruguay as a supply base, the cluster map provides a more useful starting point than national statistics. Sustainable forest products and cellulose derivatives point toward Durazno, Río Negro and Colonia’s free zone infrastructure. Premium beef with traceability documentation points toward the northern livestock departments and Canelones processing capacity. Specialty dairy products point toward San José and Florida.
For market analysts and intelligence practitioners, Uruguay’s cluster structure shows how small-country trade data can conceal important operational differences. The 3% decline in May 2026 export volumes is a composite of a strong soy harvest, a weaker beef cycle, stable cellulose volumes and a growing dairy performance. Each signal belongs to a different region, product system and buyer relationship.
The same cluster-based logic helps connect Uruguay’s export structure to other country-position themes, including Uruguay’s tourism market, Uruguay’s digital positioning and the country’s logistics exposure to regional corridors covered under Logistics & Waterways.
Conclusion
Uruguay’s export map is one of the most legible territorial trade structures in South America. The clusters are real, persistent and operationally significant. They explain why Uruguay punches above its weight in specific EU-Mercosur quota races. They explain why China concentration is a structural feature. And they explain why monthly trade data, read without the geographic lens, can mislead as often as it informs.
In a trade landscape shaped by quota mechanisms, sanitary compliance, bilateral agreements and geopolitical diversification pressures, the cluster map is primary analytical infrastructure. It shows what Uruguay can do as a global trade actor, where the risks sit and where the opportunities are located.
Need a market brief on Uruguay’s export structure or trade position?
Econosur prepares short market briefs and custom analysis for companies, analysts and institutions evaluating South American countries, export clusters, sourcing opportunities, trade risks and market-access questions.
Possible scopes include Uruguay export geography, beef, pulp, soy, dairy, rice, China exposure, EU-Mercosur quotas, free trade zones, logistics corridors or company-specific sourcing questions.
Request a Market BriefFrequently asked questions
What is Uruguay’s export map?
Uruguay’s export map refers to the territorial distribution of the country’s export production. Different regions specialize in different products: beef in the north, cellulose in the interior, soy in the west, rice in the east and dairy around San José. Understanding these clusters is key to reading Uruguay’s trade logic.
Which department exports the most in Uruguay?
In 2025, Canelones was Uruguay’s leading export department with a 16% share of total goods exports, driven mainly by beef. Colonia ranked second at 15%, supported by cellulose and beverage concentrates from its free trade zones. Montevideo came third at 14%, with a more diversified basket led by vehicles.
Why did Uruguay dominate the Mercosur EU rice quota in 2026?
Uruguay captured 63% of the Mercosur EU rice quota in the first weeks after the EU-Mercosur agreement entered provisional application on 1 May 2026. The main reason is that Uruguay is the only Mercosur partner whose rice production fully meets EU sanitary standards. The country’s eastern departments — Treinta y Tres, Rocha and Artigas — account for the bulk of that output.
How dependent is Uruguay on China as an export market?
China is Uruguay’s largest export destination, receiving 27% of total goods exports in May 2026. Sales to China are heavily concentrated in soy, cellulose and beef, which together explained 88% of Uruguay’s China-bound exports in that month.
What does Uruguay’s export geography mean for EU-Mercosur?
Uruguay’s territorial specialization gives it a clear competitive advantage in specific EU-Mercosur quota categories. Its eastern rice clusters are already capitalizing on the agreement. Beef clusters in the north and cellulose departments in the interior are positioned to follow.
What should companies understand about Uruguay’s regional production clusters?
Companies sourcing from Uruguay, investing in the country or building trade partnerships should understand that Uruguay is a cluster-based supply base. Each cluster has its own product logic, infrastructure, market connections and competitive strengths.