
Uruguay · Ports · Regional Trade · October 2026
Uruguay’s Ports in South America’s Changing Trade Corridors
Montevideo competes for container services. Nueva Palmira handles expanding bulk flows. New routes towards the Pacific add another choice to a regional transport system in which shipping lines, port operations and border procedures help determine where trade moves.
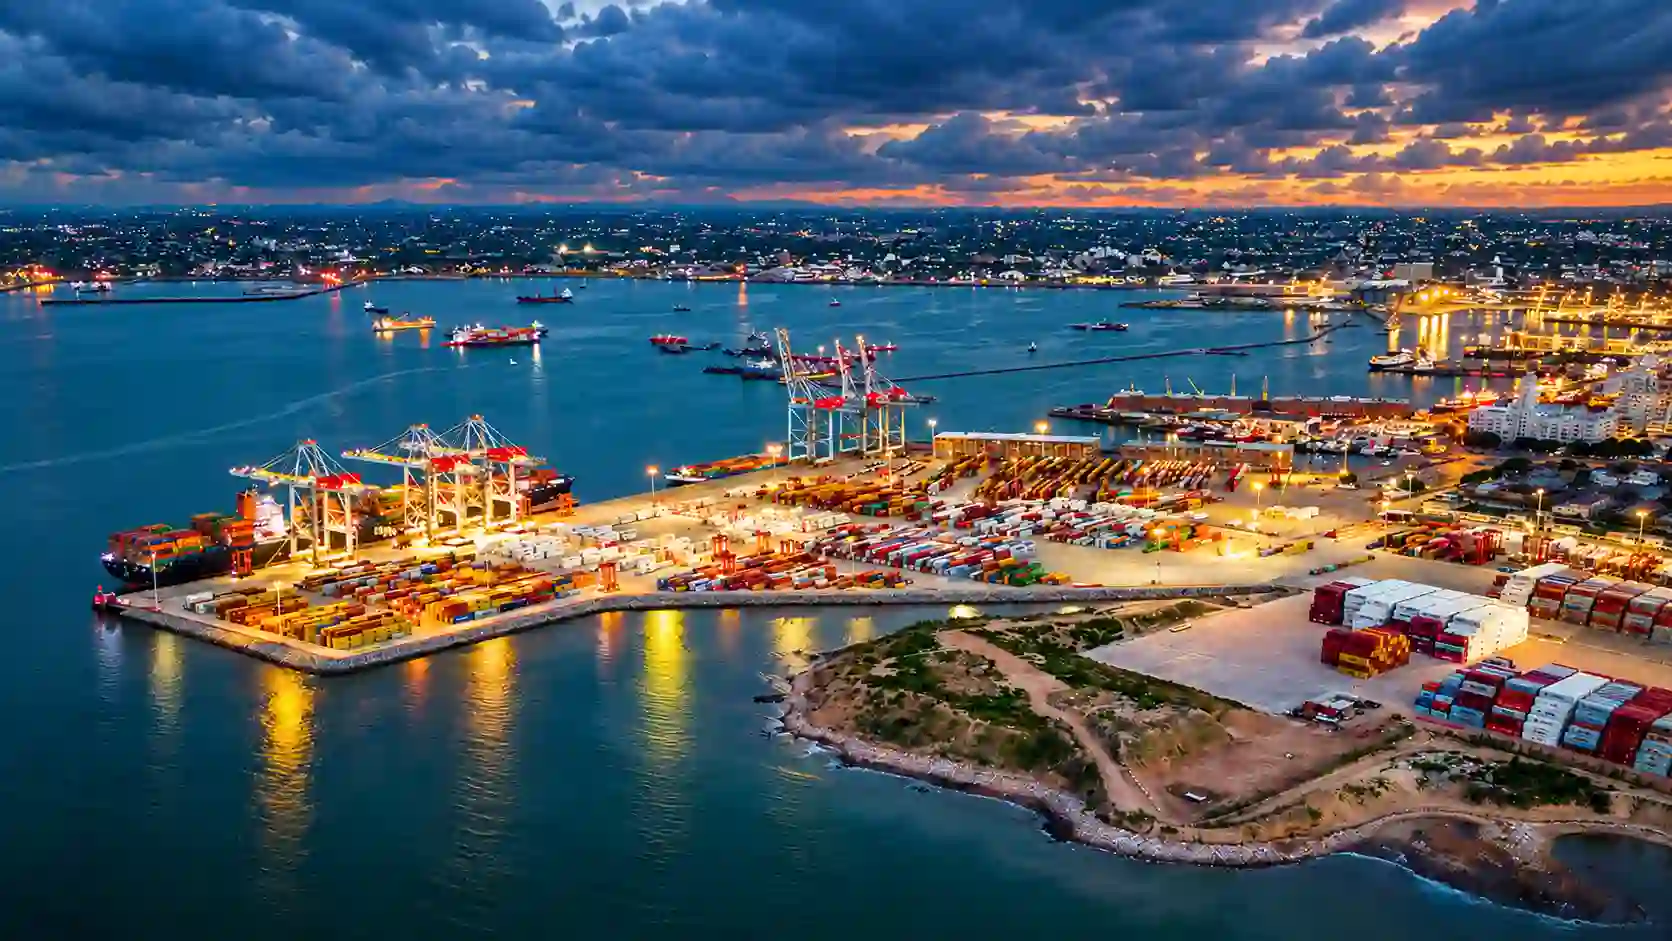 Econosur · Uruguay
Uruguay’s ports face different competitive pressures across containers, bulk commodities and regional transit. Montevideo’s loss of Paraguayan container business highlights the influence of ocean carriers and terminal negotiations. Growth in iron-ore transfer and Nueva Palmira’s bulk activity shows another part of the system expanding.
The emerging Capricornio route through Brazil, Paraguay, Argentina and Chile adds a future Pacific option. The evidence reviewed does not connect Montevideo’s recent losses to that corridor. Its full commercial operation still depends on access roads and border infrastructure.
At the Uruguay Logistics Forum on 28 October 2026, the government set out an ambition to attract more regional trade through the country’s transport network. The following day, authorities from Uruguay, Paraguay and Bolivia met in Asunción to discuss ports, waterway navigation, multimodal connections and energy. These were closely related efforts to strengthen Uruguay’s position as an Atlantic gateway for inland South America. [1] [2]
The cargo figures show why that ambition requires a closer look. Montevideo’s container activity weakened in 2025, while bulk operations grew elsewhere in the port system. A national logistics strategy therefore has to address several markets with different customers, infrastructure and route choices.
Sources: ANP annual and first-half container tables and its 30 April 2026 results release. Container tables are preliminary. Periods and geographic coverage differ; these are separate indicators. [3] [4] [5]
Uruguay seeks a larger role in inland South America’s trade
The government’s October agenda links port competitiveness with cooperation along the Paraguay–Paraná Waterway, the river system through which inland cargo reaches Atlantic shipping services. URUPABOL, the cooperation framework between Uruguay, Paraguay and Bolivia, gives that agenda an institutional channel. The Asunción meeting covered navigation, port operations, air connections and combinations of transport modes. [2]
These connections serve different economic functions. A grain cargo moving downriver, a container transferred to an ocean vessel and an industrial input distributed inland do not use the network in the same way. Their choices depend on origin, destination, handling requirements, sailing frequency and the cost of the complete journey.
The wider geography is explained in Econosur’s analysis of the Paraguay–Paraná Waterway. Uruguay’s own production base adds another layer: the territorial map of Uruguay’s exports shows why domestic cargo demand varies across agriculture, forestry and industry.
Montevideo’s statistics separate national trade from regional services
Argentina comparison: Container handling in Montevideo and regional transshipment should be compared with the cargo system, maritime services and terminal investments on the other side of the Río de la Plata. Econosur’s 2026 review of Argentina’s ports examines Dock Sud’s container upgrades alongside Gran Rosario’s grain terminals and new Atlantic oil-export infrastructure. Announced terminal capacity in one country does not by itself explain realised shipping-line calls or cargo diversions in another.
ANP, Uruguay’s National Ports Administration, records 479,392 containers, equivalent to 857,491 TEU, at Montevideo in 2025. For January–June 2026, it records 244,534 containers and 439,464 TEU. A TEU is a twenty-foot equivalent unit: a forty-foot container counts as two TEU. Both series include loaded and empty equipment. [3] [4]
The tables also distinguish ordinary loading and unloading from transit and transshipment operations. This matters because throughput is a measure of port handling. A container unloaded from one vessel and subsequently loaded onto another contributes to more than one handling operation; the port total cannot be read as a count of unique shipments.
| ANP indicator | January–December 2025 | January–June 2026 |
|---|---|---|
| Total containers handled | 479,392 | 244,534 |
| Total TEU handled | 857,491 | 439,464 |
| Ordinary loading, TEU | 243,950 | 139,646 |
| Ordinary unloading, TEU | 219,727 | 114,346 |
| Transit / transshipment loading, TEU | 170,847 | 82,682 |
| Transit / transshipment unloading, TEU | 222,967 | 102,790 |
Source: ANP’s preliminary tables. Loading and unloading rows reproduce the operational grouping; detailed customs categories appear separately in the originals. The six-month total is not compared with the annual total as a growth rate. [3] [4]
ANP’s annual results release gives a useful distinction: the authority reports a 25% reduction in container movement in 2025, while its domestic foreign-trade container aggregate rose 5% to 463,677 TEU. The latter corresponds to ordinary loading and unloading in the annual table. It is not the monetary value of all Uruguayan trade. Separately, ANP’s Cifras Portuarias 2025 gives a 23.1% fall in total TEU, from 1,115,417 to 857,491. The release’s rounded container-movement statement and the statistical presentation’s TEU comparison are retained as distinct source statements. Both show that lower aggregate handling can coexist with growth in the domestic-trade component. [5] [10]
Shipping lines help decide where Paraguayan cargo changes vessels
January reporting by El Observador links the diversion of Paraguayan transshipment business to Buenos Aires and Zárate with commercial negotiations between Mediterranean Shipping Company (MSC), the ocean carrier, and Katoen Natie, the majority owner of Montevideo’s Terminal Cuenca del Plata (TCP). The report describes disagreements over operating terms and MSC’s use of alternative regional ports. [11]
Paraguay’s ambassador to Uruguay, Didier Olmedo, told the newspaper that the change reflected ocean carriers’ decisions rather than a change in preference among Paraguayan importers and exporters. That is an attributed account of the diversion. It does not establish that every cargo moved for the same reason.
The commercial implication is broader: demand in the inland economy is only one determinant of port traffic. Shipping schedules, terminal agreements and the organisation of carrier networks influence where cargo is transferred to ocean services. A port can retain physical capacity and geographic advantages while losing a particular service or flow.
Nueva Palmira and Punta del Arenal tell a different cargo story
Nueva Palmira sits at the downstream interface between the regional river system and ocean shipping. ANP’s 2025 results record 2,258,264 tonnes of bulk cargo at the public wharf, up 8% from 2024. The scope is important: this is the public-wharf series, not a total for every private terminal in the Nueva Palmira complex. [5]
ANP’s June presentation, Cifras Portuarias 2025, reports a different Nueva Palmira bulk series: 2,216,382 tonnes and growth of 13%, against 1,961,907 tonnes in 2024. The documents reviewed do not explain the difference from the April release. The +8% indicator above therefore refers specifically to the 30 April release; the two series are not merged or treated as an established revision. [10]
At the separate Punta del Arenal Norte transfer area, ANP records 2,698,437 tonnes of iron-ore transshipment in 2025, compared with 215,681 tonnes in 2024. These tonnes cannot be added to Montevideo’s TEU figures or treated as a national iron-ore export measure. They show a substantial expansion in one specific transfer operation.
ANP’s October strategy describes repairs, additional moorings and anchorage capacity, new liquid-bulk transfer business and efforts to attract cargo from Bolivia. The direction is consistent with a port system seeking a greater role in the river economy. Projected volumes remain forecasts until actual movements confirm them. [6]
Paraguayan investment adds an ownership dimension. InfoNegocios Paraguay reported on 13 October that Grupo Zapag was promoting a multipurpose terminal in Soriano, with estimated investment of US$150 million. The report states that the project had received prior environmental authorisation from Uruguay’s Ministry of Environment. That is a more advanced stage than an unapproved proposal, but does not establish completion, commissioning or commercial operation. The planned terminal would create another transfer option on the Uruguay River. [13]
Uruguay’s position is consequently more varied than a single national port-growth figure suggests. Container services can move to Argentine terminals while river-borne bulk business expands at other Uruguayan locations.
Capricornio adds a Pacific option with an unfinished operating timetable
The Capricornio Bioceanic Corridor links Brazil’s central-west through Paraguay and northern Argentina to ports in northern Chile. Uruguay is outside its main alignment. The relevance for Uruguayan ports lies in the wider set of routes available to regional producers and traders. [9]
The distinction between physical connection and commercial service is still material. July reporting documented the joining of the bridge between Porto Murtinho in Brazil and Carmelo Peralta in Paraguay. A more recent official update, published by Mato Grosso do Sul on 29 October 2026, still identifies access roads and integrated border controls as prerequisites for full operation. [14] [8]
That update gives February 2027 as the Paraguayan government’s expected access-opening date and 2027 for completion of Brazilian accesses. It also reports a September estimate by Brazil’s federal revenue authority that full commercial operation could occur in 2028. These are dated expectations, not opening guarantees.
For Uruguay, the possible effect will depend on the cargo and its destination. A road route to a Pacific port may improve some journeys, while waterway and Atlantic services remain relevant to others. The comparison has to include inland transport, border waiting, ocean services, handling and reliability. The sources reviewed do not demonstrate that Capricornio has caused the recent diversion of Paraguayan containers from Montevideo.
Construction and border-system dependencies are examined in Econosur’s analysis of the Brazil–Paraguay bridge and corridor readiness. The comparison of the Central and Capricornio corridors explains why different bioceanic proposals should not be treated as one route.
Service reliability and environmental performance need route-level evidence
ANP’s September presentation identifies operational continuity as a competitive factor. It warns that interruptions can create extra costs and put shipping calls at risk, and calls for dialogue on minimum services during labour disputes. This is the authority’s stated concern; it does not quantify how much traffic any individual dispute caused Uruguay to lose. [7]
River navigation adds another dependency. Water levels, usable draft, dredging and terminal access influence how much cargo can move and when. The economic importance of those variables extends beyond the port boundary, as discussed in the analysis of deeper Paraná navigation and Mercosur trade.
Environmental comparisons require the same care. A shorter route on a map does not establish lower emissions per delivered tonne. A defensible assessment would include the distance by road, river and sea, vessel or truck utilisation, empty movements, handling, maintenance works and effects on affected ecosystems. The reviewed sources do not provide a comparable emissions balance for the alternative routes discussed here.
Uruguay’s port position is best understood through the decisions that keep cargo within a service network. Geography provides an Atlantic outlet, but the value retained in Uruguay depends on carrier calls, terminal agreements, reliable operations and the ability to handle particular goods at a competitive total cost.
The difference between Montevideo’s containers and the growth in bulk transfer is central. It shows that regional integration can benefit some operations while exposing others to stronger competition. Describing Uruguay simply as a growing or declining logistics hub would conceal that redistribution.
URUPABOL cooperation can help address cross-border procedures and navigation issues. Its economic contribution will become visible through implementation: more predictable journeys, workable port arrangements and sustained cargo movements. The October meetings provide an agenda against which those outcomes can be assessed.
Capricornio should be followed as an additional route whose value will emerge through actual services. For Uruguay, the immediate competitive test remains the established Atlantic network. The useful next evidence is where Paraguayan containers are being transferred, which carriers serve Montevideo, how bulk capacity is used and whether new investment translates into dependable operations.
Econosur Research Services: Ports, Logistics and Trade Corridors
Econosur researches South American trade networks, companies and infrastructure for a defined economic or commercial question. A study can examine an existing route, a proposed investment, sourcing conditions or changes in regional competition.
Separate domestic trade, regional transit and transshipment; compare periods, commodity groups and competing gateways.
Examine terminal ownership, service networks, infrastructure scope and publicly documented competitive relationships.
Check permits, construction, access works, border systems and the evidence separating announced capacity from operating services.
Track changes affecting exporters, importers, industrial operators and investors across linked South American markets.
Relevant formats include Custom Market Analysis South America, Company Reports and research within the Logistics and Waterways industry hub.
Status date: 30 October 2026. The latest corridor schedule used is the official update of 29 October; older completion expectations are not presented as current.
Statistical scope: ANP’s preliminary tables are used for Montevideo totals and operational categories. Containers, TEU, tonnes, handling movements and unique shipments are different measures. The Nueva Palmira public-wharf series is separate from the full port complex and Punta del Arenal transfer operations.
Source differences: The January newspaper report gives a different 2025 TEU total from the ANP annual table. Its figure is not used here. ANP’s April release gives Nueva Palmira bulk at 2,258,264 tonnes and +8%; its June presentation gives 2,216,382 tonnes and +13%. No documented reconciliation was found. The +8% indicator is explicitly tied to the April release. Percentage declines and Paraguay market-share estimates with different or unclear denominators are not combined into a single series.
Causality and project status: Carrier-related explanations are attributed to the reporting and interviewees. No quantified Capricornio diversion is established. Soriano is treated as a planned terminal with prior environmental authorisation reported by InfoNegocios, not as an operating facility.
Primary and Secondary Sources
- Uruguay Presidency — logistics strategy, 29 October 2026: Official account of the 28 October forum; waterway cooperation, URUPABOL and Uruguay’s regional logistics ambitions.
- Paraguay Ministry of Foreign Affairs — URUPABOL meeting, 29 October 2026: Joint agenda covering ports, waterway navigability, multimodal connections, energy and implementation criteria.
- ANP — Montevideo container statistics, January–December 2025: Preliminary annual tables: containers, TEU, loaded and empty units, loading/unloading and customs regimes.
- ANP — Montevideo container statistics, January–June 2026: Preliminary first-half tables. A six-month observation, not a full-year forecast.
- ANP — 2025 results and cargo breakdown, 30 April 2026: Original port-authority release with domestic foreign-trade container operations, Nueva Palmira public-wharf cargo and Punta del Arenal iron ore.
- ANP — Montevideo and Nueva Palmira regional strategy, 15 October 2026: Infrastructure, anchorage and transfer operations, multimodal integration, dredging and plans to attract regional cargo.
- ANP — priorities and operational continuity, 16 September 2026: Authority’s assessment of service predictability and the commercial risks of operational interruptions.
- Government of Mato Grosso do Sul — integrated customs and access roads, 29 October 2026: Current official update: Paraguayan access expected February 2027, Brazilian accesses in 2027; reports a September federal estimate of possible full commercial operation in 2028.
- Capricornio Bioceanic Corridor — institutional route and territories: Geographic reference: Brazil, Paraguay, Argentina and Chile. Uruguay is outside the main corridor alignment.
- ANP — Cifras Portuarias 2025, June 2026: ANP statistical presentation: Nueva Palmira bulk at 2,216,382 tonnes and +13%; differs from the 30 April release. Montevideo TEU total at 857,491, down 23.1% from 2024.
- El Observador — Paraguayan transshipment and shipping-line decisions, 29 January 2026: Reporting on MSC, terminal negotiations and diversions to Buenos Aires and Zárate; includes the Paraguayan ambassador’s account. Its annual TEU total differs from the ANP table used here.
- Datamar News — ANP annual results, 5 May 2026: Specialist reporting summarising ANP’s results. Corroborating coverage of the same authority data, not an independent statistical series.
- InfoNegocios Paraguay — proposed Zapag terminal in Soriano, 13 October 2026: Reports an estimated US$150 million multipurpose-port project and the sector’s demand for additional transfer capacity. Reports prior environmental authorisation; does not establish an operating terminal.
- Datamar News / Folha de São Paulo — bridge and access-road progress, 28 July 2026: Dated reporting on the July bridge-joining milestone. Access schedules in that report are superseded here by the 29 October official update.
Source method: Port tables establish the stated handling volumes. Government and port-authority announcements document institutional positions and project schedules, without independently proving their expected benefits. Journalism adds interviews, commercial context and investor statements. Econosur’s related articles provide internal context; they are not substitutes for the external evidence. The perspective section presents analysis derived from the reviewed material.
Research South America’s Ports and Trade Corridors
For a defined trade-flow, company, infrastructure or regional market question, Econosur can examine the evidence connecting inland production, transport services and international markets.
Explore custom ports and trade-corridor researchFrequently Asked Questions
What role do Uruguay’s ports play in regional trade?
Montevideo connects container services with regional cargo, while Nueva Palmira links river-borne bulk cargo with ocean shipping. Their activity includes Uruguay’s own trade and goods originating elsewhere in South America.
How much container traffic did Montevideo handle in 2025?
ANP’s preliminary annual table records 479,392 containers, equivalent to 857,491 TEU, including loaded and empty units and both loading and unloading operations.
Is Uruguay part of the Capricornio Bioceanic Corridor?
Uruguay is not on the main route through Brazil, Paraguay, Argentina and Chile. Its ports provide Atlantic-facing services within the wider regional transport network.
Has Capricornio caused Montevideo’s loss of Paraguayan cargo?
The reviewed sources do not establish that connection. January 2026 reporting instead links diversions to Argentine ports with shipping-line decisions and terminal negotiations.
Is the new Brazil–Paraguay bridge a fully operating trade corridor?
Physical bridge connection is separate from full commercial operation. An official update of 29 October 2026 still identifies access roads, customs infrastructure and coordinated controls as prerequisites.
What can Econosur research about ports and trade corridors?
Econosur can examine cargo flows, port and operator structures, project status, regional competition and cross-border commercial dependencies for a defined research question.