
Who Controls
Argentina’s Soy
Export Industry?
Bunge leads first-half 2026 soybean-complex export registrations, but control of Argentina’s soy business is broader than one ranking. Crushing plants, Paraná terminals, the trunk waterway, tax rules and global demand determine who controls each layer of the value chain.
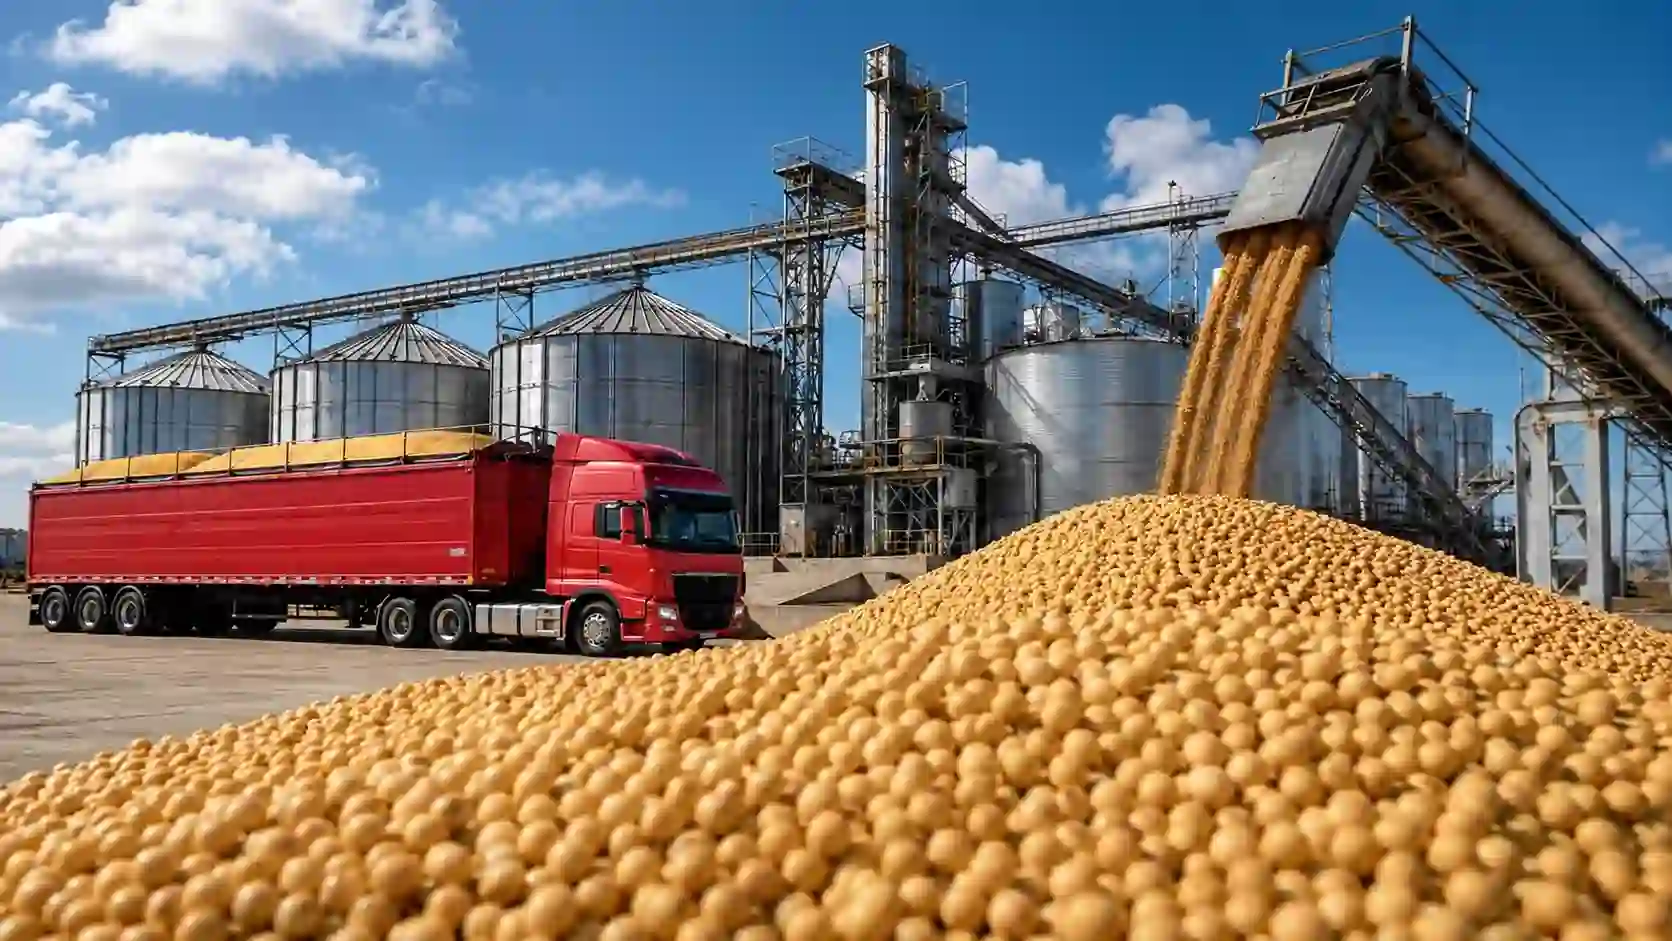
Argentina is usually described as one of the world’s major soybean exporters. That description hides the structure that makes the business unusual. A large part of the country’s soy value leaves not as raw beans but as meal, pellets and oil produced in a geographically concentrated crushing and port system around the Paraná River.
The question of who “controls” the industry therefore has no single answer. Export-sale registrations show one ranking. Crushing capacity shows another. Port ownership and joint ventures create a third layer. The Paraná–Paraguay waterway, export-tax differentials and demand from China add further constraints that no company controls alone.
Market signal: export leadership and physical control are not the same thing
In the first half of 2026, Argentina registered 13.7 million tonnes of soybean-complex export commitments under the DJVE system. Bunge accounted for 4.5 Mt, or 33%, followed by Cargill with 13% and Molinos Agro with 11%, according to Bolsa de Comercio de Rosario calculations based on official DJVE records.
Those figures are commercially important, but they are not a ranking of physical shipments through company-owned terminals. DJVE measure registered export commitments. A company may register a sale, process beans in one asset, use a joint-venture terminal or ship through infrastructure whose ownership structure is different again.
Bunge’s 33% share is partly a consolidation story
Bunge’s first-half 2026 position has to be read together with the Bunge–Viterra combination. Bunge completed the global merger on July 2, 2025. BCR reports that operational integration in Argentina was completed in January and February 2026, after which Viterra stopped registering agro-industrial export sales separately and volumes increasingly appeared under Bunge.
Across the six main agro-industrial complexes, Bunge registered 11.6 Mt in first-half 2026. BCR calculates 11.8 Mt when Bunge and the residual Viterra legal entity are combined, equivalent to 22% of total registered tonnage. In the soybean complex specifically, Bunge’s 4.5 Mt represented one third of H1 registrations.
Interpretation: part of the apparent jump in concentration reflects corporate integration and reporting structure, not simply a sudden organic capture of one third of the physical soybean trade.
Argentina’s soy export industry is fundamentally a processing industry
The composition of first-half 2026 registrations shows why the crushing layer matters. 76% of soybean-complex tonnage was by-products, 16% soybean oil and only 8% soybeans. The export system is therefore built around industrial transformation as much as around crop origination.
The industrial cycle was strong going into the final quarter of 2026. The Secretariat of Agriculture reported 4.252 million tonnes of soybeans crushed in August, 8.81% more than in August 2025 and the highest August volume in the last ten campaigns.
At the same time, Argentina’s historical processing advantage is no longer expanding faster than its competitors. BCR reported in July that Argentina had fallen behind the United States and Brazil to third place in soybean crushing capacity among the main exporting competitors, as biofuel-driven investment accelerated elsewhere while local capacity grew more slowly.
Company map: who controls which layer?
| Company / asset | H1 2026 soy DJVE position | Physical assets relevant to control | What the evidence shows |
|---|---|---|---|
| Bunge | 4.5 Mt · 33% | Integrated origination, processing and export assets; shareholder in Terminal 6 with AGD | Largest registered exporter in the soybean complex after the Viterra integration. Terminal 6 has more than 20,000 t/day soybean crushing capacity. |
| Cargill | 1.8 Mt · 13% | Ports at Bahía Blanca, Diamante, Punta Alvear and San Martín; processing at Villa Gobernador Gálvez and San Martín | Second in H1 soybean-complex registrations and vertically present in origination, processing, trading and ports. |
| Molinos Agro | 1.5 Mt · 11% | San Lorenzo plant and integrated San Benito port | 20,000 t/day soybean crushing capacity; port loading capacity of 8 Mt/year according to the company. |
| Louis Dreyfus Company | Not stated in BCR’s soy top-three table | General Lagos and Timbúes complexes; Bahía Blanca deep-water port | General Lagos processes 2.5 Mt/year of soybeans; LDC reports roughly 19,000 t/day combined processing capacity across its two major Rosario-area plants. |
| COFCO International | Not stated in BCR’s soy top-three table | Nine storage sites, three soybean/sunflower crushing plants and a biodiesel plant | Large integrated operator with trading, processing and logistics assets in Argentina. |
| ADM | Not stated in BCR’s soy top-three table | Bahía Blanca, San Martín–El Tránsito and Arroyo Seco ports | Important export-infrastructure operator, but port presence should not be converted into an inferred soy-complex market share. |
| AGD / Terminal 6 | Separate soy share not stated here | Terminal 6 joint venture with Bunge | T6 integrates reception, storage, crushing and shipment and has more than 20,000 t/day soybean crushing capacity. |
The table deliberately separates registered export share from physical assets. Where BCR does not publish a first-half 2026 soybean-complex share in the cited ranking, no share is inferred from port or processing capacity.
The Paraná corridor is part of the industry’s market structure
Argentina’s soy industry is unusually concentrated around crushing plants and export terminals connected to the Paraná. Official traffic data for the Vía Navegable Troncal state that the corridor carries around 80% of Argentina’s export volume and 90% of agro-industrial exports.
In June 2026 the government awarded the new concession to the Jan de Nul–Servimagnus consortium, and the concession contract was signed in July. The government said the new arrangement initially reduced the waterway toll by 13.5% while beginning a programme of deepening and modernization.
The longer-term toll path is contested. Agribusiness specialist Alejandro Bustamante has argued that the concession design could raise logistics costs and weaken export competitiveness over the contract period. That is a sector view rather than the government’s cost estimate, but it matters because tolls and achievable draft directly affect the economics of the Paraná export corridor.
This does not mean the concessionaire controls Argentina’s soybean trade. It means virtually every major exporter and crusher in the Paraná cluster is exposed to a shared logistics layer whose depth, toll structure, maintenance performance and navigation rules affect the economics of loading ships. The issue connects directly with Econosur’s analysis of the deeper Paraná River and Mercosur trade.
Export taxes still shape the choice between beans and processing
The 2026 tax structure retains a differential between soybeans and processed products. A permanent reduction introduced in December 2025 lowered the export duty on soybeans to 24% and on soybean by-products to 22.5%. Decreto 423/2026 then established a further gradual reduction beginning in January 2027.
The policy matters to market structure because the differential changes the relative economics of exporting beans versus crushing them domestically. Under the 2026 schedule, the gap between the soybean rate and the main processed-soy rates narrows from 1.5 percentage points to 1 point by December 2028. The processing advantage is therefore preserved, but reduced. It remains one component of crusher margins alongside international meal and oil prices, freight, plant utilization and soybean availability.
For fiscal scale, BCR estimates that Argentina’s six main agricultural chains will contribute around US$4.613 billion in export duties during 2026. That figure covers soybean, corn, wheat, sunflower, barley and sorghum chains together, not soy alone.
The wider macroeconomic importance is also visible in the sector’s foreign-exchange role. CIARA-CEC, citing INDEC, reported that the oilseed-cereal complex including biodiesel and derivatives accounted for 45% of Argentina’s total exports in 2024. CIARA-CEC’s monthly liquidation series is therefore useful as a sector-level indicator, but it should not be read as a company market-share measure.
Vicentin shows how control can change without building a new plant
The Vicentin restructuring is a useful counterpoint to organic investment. After years of insolvency proceedings, Molinos Agro and Louis Dreyfus Company withdrew appeals against the court-approved cramdown in May 2026, clearing a major legal obstacle for the Grassi-led structure to continue operating the company’s assets.
The case matters because Argentina’s crushing geography is already highly developed. Market structure can therefore change through mergers, restructurings, joint ventures and control of existing plants as much as through new greenfield capacity.
China can shift the balance between raw beans and local processing
Argentina’s exporters do not determine the product mix alone. Buyer demand matters. Reuters reported on September 30 that private Chinese crushers were still sourcing soybeans from Brazil and Argentina while U.S. soybeans remained outside a new round of tariff reductions and Chinese crushing margins were weak.
For Argentina, stronger Chinese demand for whole beans can pull in the opposite direction from domestic crushing economics. That creates a recurring tension between selling raw beans into a large destination market and keeping more processing volume inside the local meal-and-oil complex.
Marcus A. Volz perspective
The useful question is not who owns Argentina’s soy industry, but who controls each commercial layer.
Bunge currently leads registered soybean-complex export commitments, but that does not make Bunge the owner of one third of the country’s crushing capacity, ports or physical shipments. The industry is a network of overlapping positions: traders register export sales, crushers transform beans, some ports are vertically integrated, some assets are joint ventures, the trunk waterway is a shared concession infrastructure and tax rules influence the product mix.
This distinction becomes more important as concentration changes. The Bunge–Viterra combination altered the exporter ranking through consolidation. Vicentin shows that control of existing assets can move through restructuring. LDC announced in June 2026 a new sunflower-and-soy processing plant integrated with its existing Bahía Blanca storage, logistics and deep-water port infrastructure. In January 2026, it also started operating a specialized high-oil-content seed crushing line at Timbúes, complementing the site’s existing soybean crushing operations. At the same time, Argentina has lost its former lead in total soybean crushing capacity among the main export competitors.
The commercial map therefore has to be updated at asset level. A ranking based only on export tonnage misses where plants are located, which terminals they can access, who owns joint ventures, how much capacity is actually utilized, where soybeans are sourced and which destination markets are pulling raw beans versus processed products.
That is also why the broader regional production cycle matters downstream: a larger crop does not create value uniformly. The benefit is distributed through the companies and infrastructure that can originate, process, store and move the additional volume.
Three business questions that require deeper research
1. Which companies control the relevant asset, not just the export registration?
A target-company analysis should separate the exporter named in DJVE data from the crusher, terminal owner, joint-venture partners, logistics provider and commercial buyer. Those roles can sit with different companies.
2. Where is capacity actually available?
Nameplate crushing capacity does not show utilization, seasonal maintenance, feedstock availability, tolling arrangements, third-party processing or the practical ability to absorb additional soybeans. Plant-level verification is required.
3. Which policy and logistics costs change the commercial route?
DEX differentials, Paraná tolls and draft, rail or truck access, imported Paraguayan beans, destination-market demand and financing conditions can change whether volume is exported as beans, meal or oil and which company captures the margin.
Public data show market structure, but not the full commercial structure.
DJVE records do not show contract margins, customer concentration, toll-processing arrangements, plant utilization, approved-vendor relationships, terminal-slot constraints or the internal decision makers behind procurement and commercial partnerships.
Research services for Argentina’s soy and agro-industrial market
Econosur can structure research around one exporter, crusher, port, supplier category, destination market or defined commercial question in Argentina and the wider Southern Cone.
Where the objective is a concrete commercial connection, Econosur can also identify and screen relevant processors, exporters, port operators, logistics companies, industrial suppliers, buyers and business partners and facilitate introductions where there is a relevant fit. See B2B Connections in South America.
Soy & Agroindustrial Market Brief: a focused assignment can map exporter shares, crushing assets, port ownership, joint ventures, feedstock sources, logistics corridors, destination exposure, policy costs, buyer structures, supplier opportunities and unresolved data gaps.
The format is designed for market screening, competitor analysis, target-account research, supplier positioning and partner identification.
Company & Asset Mapping
Map exporters, crushing plants, ports, terminals, storage assets, joint ventures and ownership changes.
Exporter & Buyer Analysis
Separate registered export commitments, physical shipment channels, destination markets and buyer concentration.
Logistics & Waterway Exposure
Assess Paraná access, terminal dependence, tolls, draft, barge flows and upstream sourcing from the wider Paraguay–Paraná system.
Policy & Margin Context
Track export duties, product differentials, DJVE rules and other policy variables that affect beans versus processing economics.
Supplier & Procurement Research
Identify industrial equipment, maintenance, storage, automation, logistics and service opportunities around crushers and terminals.
B2B Connections
Identify and screen relevant counterparties and facilitate direct introductions where the requirement and commercial fit are clear.
Research boundary
DJVE registrations are not physical shipment data. The BCR ranking measures registered export-sale commitments under the official DJVE system, not cargo physically loaded through a specific company terminal.
Nameplate capacity is not utilization. Company-reported crushing capacity describes the technical scale of assets, not actual daily throughput, margins or available third-party capacity.
Port presence is not a soy-market share. A company can operate a major terminal without holding the same percentage of soybean-complex exports.
H1 2026 is a snapshot. Export registrations can shift materially through the year with crop timing, tax rules, company integration and destination demand.
Econosur interpretation: market power in Argentina’s soy complex is layered. Export registration, processing capacity, terminal access, logistics infrastructure and policy exposure should be analyzed separately before drawing conclusions about control.
Frequently asked questions about Argentina’s soy export industry
Who leads Argentina’s soy export industry in 2026?
For the first half of 2026, Bolsa de Comercio de Rosario data based on DJVE export-sale registrations show Bunge leading the soybean complex with 4.5 million tonnes, or 33% of registered volume, followed by Cargill with 13% and Molinos Agro with 11%. These figures measure registered export commitments, not physical shipments through a specific terminal.
Why are soybean meal and oil more important than raw beans in Argentina’s export structure?
Argentina built a large crushing industry around Gran Rosario. In first-half 2026 DJVE registrations for the soybean complex, 76% of volume was soybean by-products, 16% soybean oil and only 8% soybeans. That makes processing capacity, port integration and tax differentials central to market structure.
Does Bunge control one third of Argentina’s soybean ports or crushing capacity?
No. Bunge’s 33% figure refers to first-half 2026 DJVE registrations for the soybean complex. Port ownership, crushing capacity, terminal throughput and registered export sales are different measures and should not be treated as interchangeable.
Why does the Paraná waterway matter to the soy industry?
The Vía Navegable Troncal carries about 80% of Argentina’s export volume and around 90% of agro-industrial exports according to official traffic data. The concentration of crushing plants and terminals along the Paraná therefore makes river depth, tolls, navigation conditions and concession performance material to export competitiveness.
How can Econosur research Argentina’s soy and agro-industrial market?
Econosur can map exporters, crushing assets, ports, logistics corridors, ownership structures, policy exposure, target companies, suppliers and commercial counterparties for a defined market or business question.
Need a company-level view of Argentina’s soy market?
Econosur can map exporters, crushers, ports, logistics corridors, supplier positions, ownership structures and buyer relationships around a defined commercial question.
Request a soy-market analysis